ELK and Logging Configuration
Among the six areas to consider when designing a microservice-based application,
there is an area called Telemetry, or Observation.
This area covers logging, monitoring, and tracing, with each function defined as follows:
- Logging | Centralization and aggregation of distributed log files generated by multiple, separate services.
- Monitoring | Monitoring strategy for multiplexed services.
- Tracing | A method for tracking multiple call relationships between microservices for a single client request.
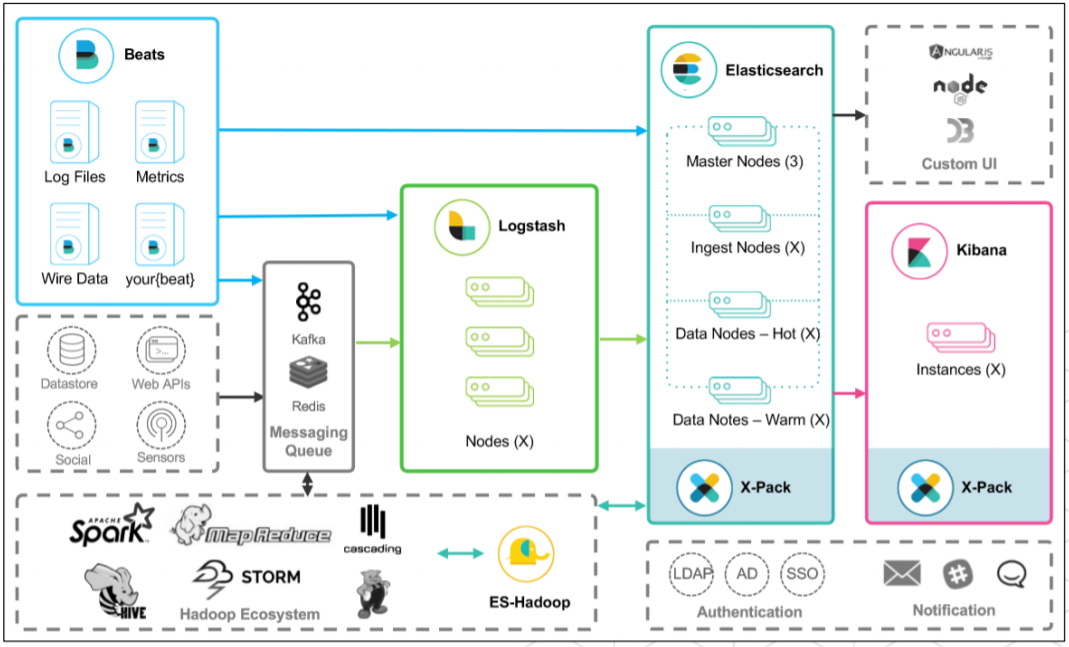
The most commonly used logging approach in microservices is ELK, which consists of Elasticsearch, Logstash, and Kibana (EFK uses Fluentd).
Logging Configuration using ELK #
Looking at the functions of each ELK solution, it has a visualization structure where data is aggregated through Logstash, indexed and stored through Elasticsearch, and then the indexed data is displayed through Kibana.
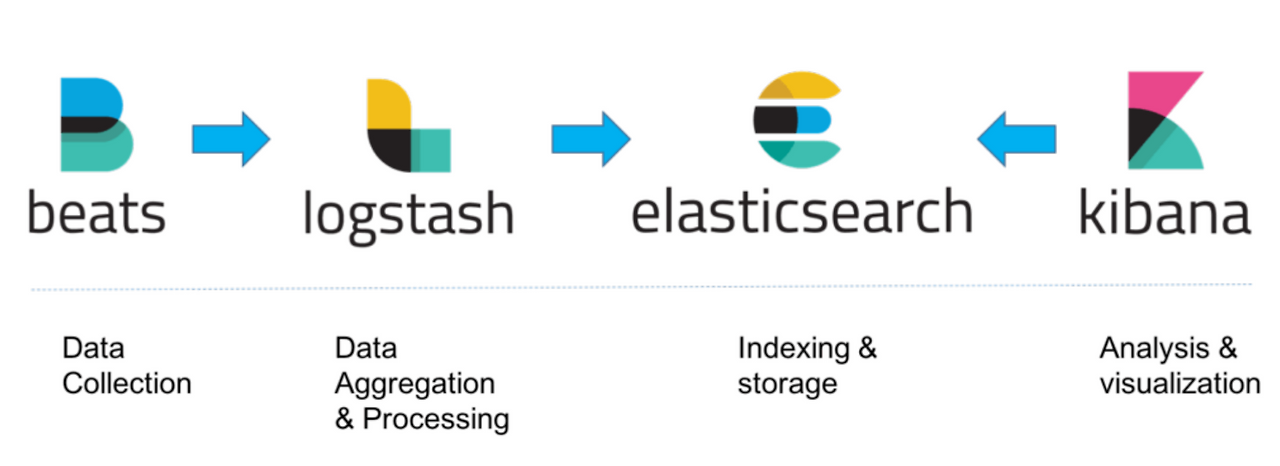
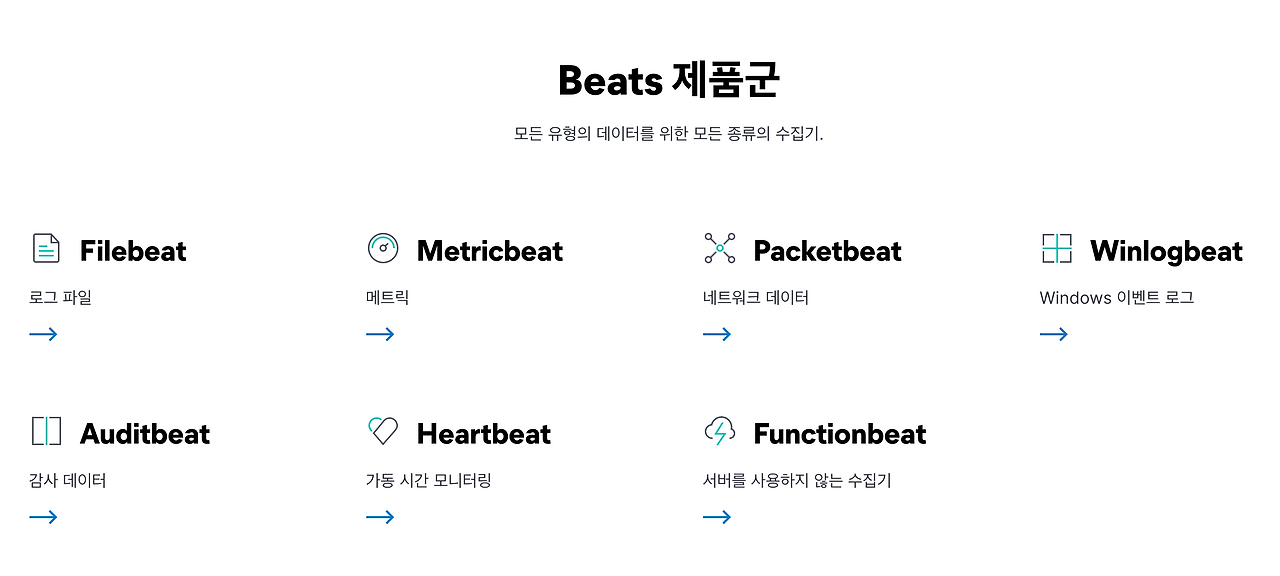
Looking at the image above, there is an additional solution called Beats. Beats is a lightweight data collection solution, composed of various products for data collection.
Below are various architectures that can be configured with Beats + ELK.