JVM Warm Up - Causes of Latency Degradation Immediately After Deployment
If an application server developed in a JVM language is redeployed, for reasons such as rolling deployment, you can observe that the TPS remains constant immediately after deployment, but significant latency occurs.
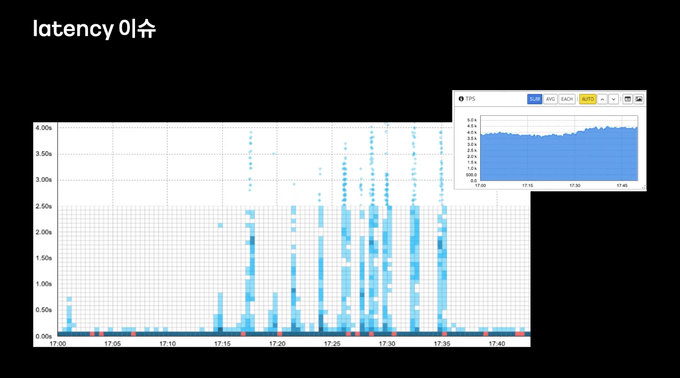
Let's examine why latency occurs immediately after deployment.
Class Loader #
Before understanding the causes of latency, we first need to briefly understand the process of Java class loading. In the JVM, a Java class loader is used to read Java classes. The class loader is responsible for finding class files, loading them into memory, and making them executable. It operates in the following sequence:
- Class Loading: Fetches class files and loads them into JVM memory. This stage is broadly divided into Bootstrap Class Loading (loading JVM core classes and Java code), Extension Class Loading (loading Java core libraries), and Application Class Loading (loading classes written by developers and found in the classpath).
- Class Linking: This stage verifies other classes, methods, and fields referenced by the class and links them in memory. This stage is also broadly divided into Verification, Prepare, and Resolution.
- Class Initialization: Performs class initialization tasks, such as initializing class variables or executing code within static blocks.
Classes go through multiple stages with the operations described above, and thus, class loading is considered a relatively heavy operation. So, why did I bring up class loaders for JVM Warm-up? Let me explain:
Class loaders generally operate using a Lazy Loading mechanism. Lazy Loading is a method where classes are not loaded when the application starts, but rather their loading is delayed until they are needed. Simply put, the class loader loads a class the first time it becomes necessary.
This Lazy Loading is the first reason latency occurs. Immediately after deployment, most classes have not been used even once, so they are not loaded into memory by the class loader. When a request comes into the web application in such a state, the class loader then hastily loads the classes into memory. Latency occurs during this process.
JIT Compiler #
Java Compilation Process #
First, let's look at Java's compilation process: code written in Java is compiled into an intermediate language called bytecode. This is a file with a .class extension. This bytecode is bundled with various resources used by the application and archived into executable Jar or War files. When these Jar or War files are executed after this build process, the JVM reads the bytecode line by line and translates it into machine code. This process is called interpretation.
The reason for using bytecode can be understood by considering the JVM's core philosophy: "Write Once Run Anywhere." Java aims to be a platform-independent language, whereas languages like C, C++, Go, and Rust, whose source code is directly compiled into machine code, require compilation according to the hardware running the application, as CPU architectures like x86, x64, and ARM have different instruction sets and register structures.
Java solved this problem by using bytecode, handling platform-dependent tasks when translating JVM bytecode into machine code. This allows Java to have high portability.
However, the problem with this approach is, naturally, that execution speed is relatively slow. This is a chronic issue with all interpreted languages, often compared to reading a translated book in a compiled language versus buying an original book in an interpreted language and deciphering it line by line. Naturally, the latter would be slower. Furthermore, compiled languages perform code optimization during source code compilation. Therefore, the performance of an interpreter is bound to be inferior compared to a compiled language that reads already optimized and prepared machine code.
Introduction of JIT Compiler #
To solve the problems mentioned above, the JVM introduced the JIT compiler. The JIT Compiler dynamically compiles bytecode into machine code during application execution (and caches it for use). When this compiled code is executed, it can run much faster than an interpreter executing bytecode.
However, if the application were to translate all bytecode into machine code upon startup, the application's startup time would likely become too long. Therefore, a good balance must be struck between application execution time and optimization, and the JIT compiler must decide which parts of the code to translate into machine code.
The JIT compiler compiles only specific parts of the application that are determined to be frequently executed into machine code. These parts are called hotspots. The JIT compiler analyzes the behavior of the running application, measuring and recording information such as code execution counts, loop iteration counts, and method calls. This is called profiling. Based on the profiling results, the JIT compiler identifies hotspots, and once a hotspot is identified, the JIT compiler translates the bytecode into machine code on a method-by-method basis.
The JIT compiler stores this translated machine code in the code cache. Storing machine code in the code cache allows code identified as a hotspot to be reused from the code cache without recompilation, leading to performance improvement.
Internal Operation #
Looking more closely at the internal workings of the JIT Compiler, you can see that the compilation process is divided into several stages based on the optimization level, which is called Tiered Compilation.
Let's explore the two compilers that exist in the JIT Compiler: C1 and C2.
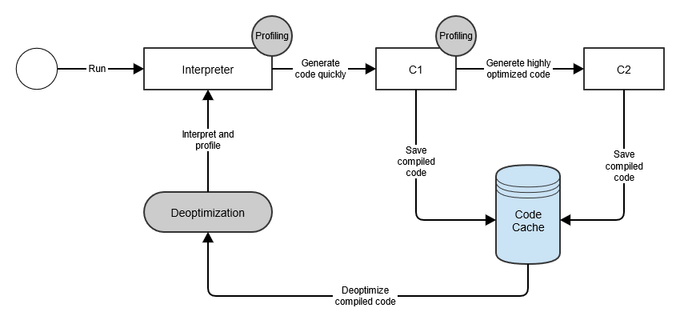
The C1 compiler optimizes and compiles code as quickly as possible for the fastest possible execution speed. If a specific method is called above the C1 compiler's threshold setting, the code for that method is optimized to a limited extent via C1, and the compiled machine code is stored in the code cache.
Subsequently, if a method is called more frequently than the C2 compiler's threshold, the code is optimized and compiled by C2. The C2 compiler performs a higher level of optimization than the C1 compiler. Once optimization and compilation are complete, the machine code is similarly stored in the code cache.
Typically, C1 is suitable for desktop applications where fast execution is critical, while C2 is suitable for server applications where speed after initial execution is important.
JIT Tiered Compilation is divided into a total of 5 levels through the interpreter, C1, and C2. Level 0 is the interpreter, levels 1 to 3 are performed by C1, and level 4 is performed by the C2 compiler.
- level 0 interpreted code: The JVM initially executes all code through the interpreter. As previously discussed, this stage has lower performance than executing compiled machine code.
- level 1 simple c1 compiled code: Level 1 is used for methods that the JIT compiler deems simple. Methods compiled at this level have low complexity, so compiling them with C2 would not improve performance. Therefore, no additional optimization is needed, and no profiling information is collected.
- level 2 limited c1 compiled code: This stage performs profiling and optimization at a limited level and is executed when the C2 compiler queue is full.
- level 3 full c1 compiled code: This stage performs profiling and optimization at the maximum level. That is, it is executed under normal circumstances.
- level 4 c2 compiled code: The C2 compiler performs optimization for the long-term performance of the application. Code optimized at level 4 is considered fully optimized and no longer collects profiling information.
Immediately after a server is deployed, the JIT compiler has not compiled any code into machine code, and therefore, no machine code is loaded into the code cache. Consequently, code at the point of deployment is executed by the interpreter or accompanied by the optimization and compilation process of the C1 and C2 compilers, inevitably leading to performance degradation. This is the second cause of latency.
To solve this problem, we perform JVM Warm-UP. We will explore this in the next article.