Parallel GC Hang Alert
In a batch system I was managing, a full GC hang occurred, causing an already heavy task to run indefinitely.
It was a settlement task that usually finished in 3-4 hours, but on a weekend, even after 8 hours, there was no notification that it had finished.
Just in case, I checked and there was no OOM. Looking at the logs, about 20% of the data had been processed. After another 2 hours, I checked again and it was processing 21%, and eventually, an OOM occurred.
The batch system's GC was Parallel GC, and I knew that due to recent growth, there was more data to process.
What I found strange here was why OOM didn't happen sooner, and after checking the GC logs with jstat, I confirmed a full GC hang. I thought that if there had been a system to detect this, I wouldn't have had to spend my weekend like that.
Visibility #
First, the batch system needed JVM-level observability. Since it was a pure Java batch system based on OpenJDK 8, the /metric endpoint provided by Spring Boot Actuator couldn't be used.
However, by launching a separate JAR file called JMX Prometheus Exporter on a different port and bundling it with the Dockerfile, a Prometheus exporter that collects JMX metrics can be run on a different port within the same container.
java -jar -javaagent:./jmx_prometheus_javaagent.jar=9404:./config.yaml savings-bank-api.jar
By setting it up on port 9404 and adding jmx_prometheus_javaagent to an initContainer job, it can be launched together immediately.
initContainers:
- name: jmx-agent-downloader
  image: curlimages/curl:8.6.0
  command:
    - sh
    - -c
    - |
      echo "[Init] Downloading jmx_prometheus_javaagent.jar..."
      mkdir -p /opt/jmx && \
      curl -fSL -o /opt/jmx/jmx_prometheus_javaagent.jar \
      https://repo1.maven.org/maven2/io/prometheus/jmx/jmx_prometheus_javaagent/0.20.0/jmx_prometheus_javaagent-0.20.0.jar && \
      ls -lh /opt/jmx && \
      echo "[Init] Done."
  volumeMounts:
    - name: jmx-exporter-volume
      mountPath: /opt/jmx
Mount the volume, download the JAR as shown, and launch it together. Of course, also open the port so Prometheus can scrape it.
Full GC Hang #
If using JMX Exporter, the following two metrics are key:
jvm_gc_collection_seconds_sum: Cumulative time spent on GC (most important)jvm_gc_collection_seconds_count: Number of GC occurrences.
At this point, only Major (Full) GC should be filtered, not Minor GC.
- Parallel GC:
gc="PS MarkSweep" - G1GC:
gc="G1 Old generation"
Now that we know which metrics to use, we need to consider what criteria to use for determining a hang.
For example, in our scenario, did GC take more than 10 seconds in the last minute? (GC Overhead)
We need to detect a GC Thrashing state where the system hasn't completely stopped, but the CPU is mostly occupied by GC.
increase(jvm_gc_collection_seconds_sum{gc="PS MarkSweep"}[1m]) > 10
This means more than 10 seconds were spent cleaning in the last minute, implying over 16% CPU loss. Since this is a monthly settlement batch, this duration is too short. We decided to consider it a GC hang if GC consumed about 30 seconds, or 50% of the time.
The batch runs at 2 AM, and even if it finishes within 4 hours, on a weekend, it essentially just needs to finish within 24 hours. So, GC consuming up to 50% was a lower priority.
A single long Full GC duration is not critical. This was a batch job, and its nature was not to solve issues where individual customers receive slow responses and P99 is broken, so this was not considered.
Exceptional Cases
Additionally, since JMX Prometheus Exporter fetches metrics, it can also be affected by Full GC. If Full GC is too severe, Prometheus might time out when trying to scrape data and fail to retrieve it.
Therefore, the phenomenon of metrics being interrupted also needs to be detected.
scrape_duration_seconds{job="my-batch-job"} > 5
AlertManager #
The alert system is implemented via AlertManager based on these metrics.
prometheus_rules.yaml
groups:
- name: BatchJobAlerts
  rules:
  - alert: FullGCHangDetected
    # Full GC 시간이 1분간 20초 이상일때
    expr: |
      increase(jvm_gc_collection_seconds_sum{gc="PS MarkSweep"}[1m]) > 20
    for: 1m  # 이 상태가 1분간 지속되면 알림 발송
    labels:
      severity: critical
    annotations:
      summary: "배치 서버 Full GC Hang 감지 (Instance {{ $labels.instance }})"
      description: "현재 Full GC로 인해 시스템이 멈춰있습니다. 힙덤프 확보가 필요할 수 있습니다."
This way, a GC hang can be detected.
Subsequent Actions #
Afterward, I looked into several reasons. Although the issue of lacking observability in the batch system was resolved, including that problem, the current batch system had the following issues:
- Lack of observability
- Full GC Hang
- OOME
First, I needed to investigate the Full GC Hang that was detected but not resolved. There was also an issue where OOM was not at the JVM level but due to the Kernel Level OOM Killer, leaving no dump (and there wasn't even an option to generate a dump).
The reason for the Full GC Hang was simple. The settlement batch task operated by simply getting all the data it used, loading it into memory, mapping it to DTOs for aggregation, and then inserting/uploading it to the data lake. The hang occurred because too much data was loaded into memory.
It ambiguously didn't hit OOM, then Full GC occurred, then no OOM, then Full GC again... and so on.
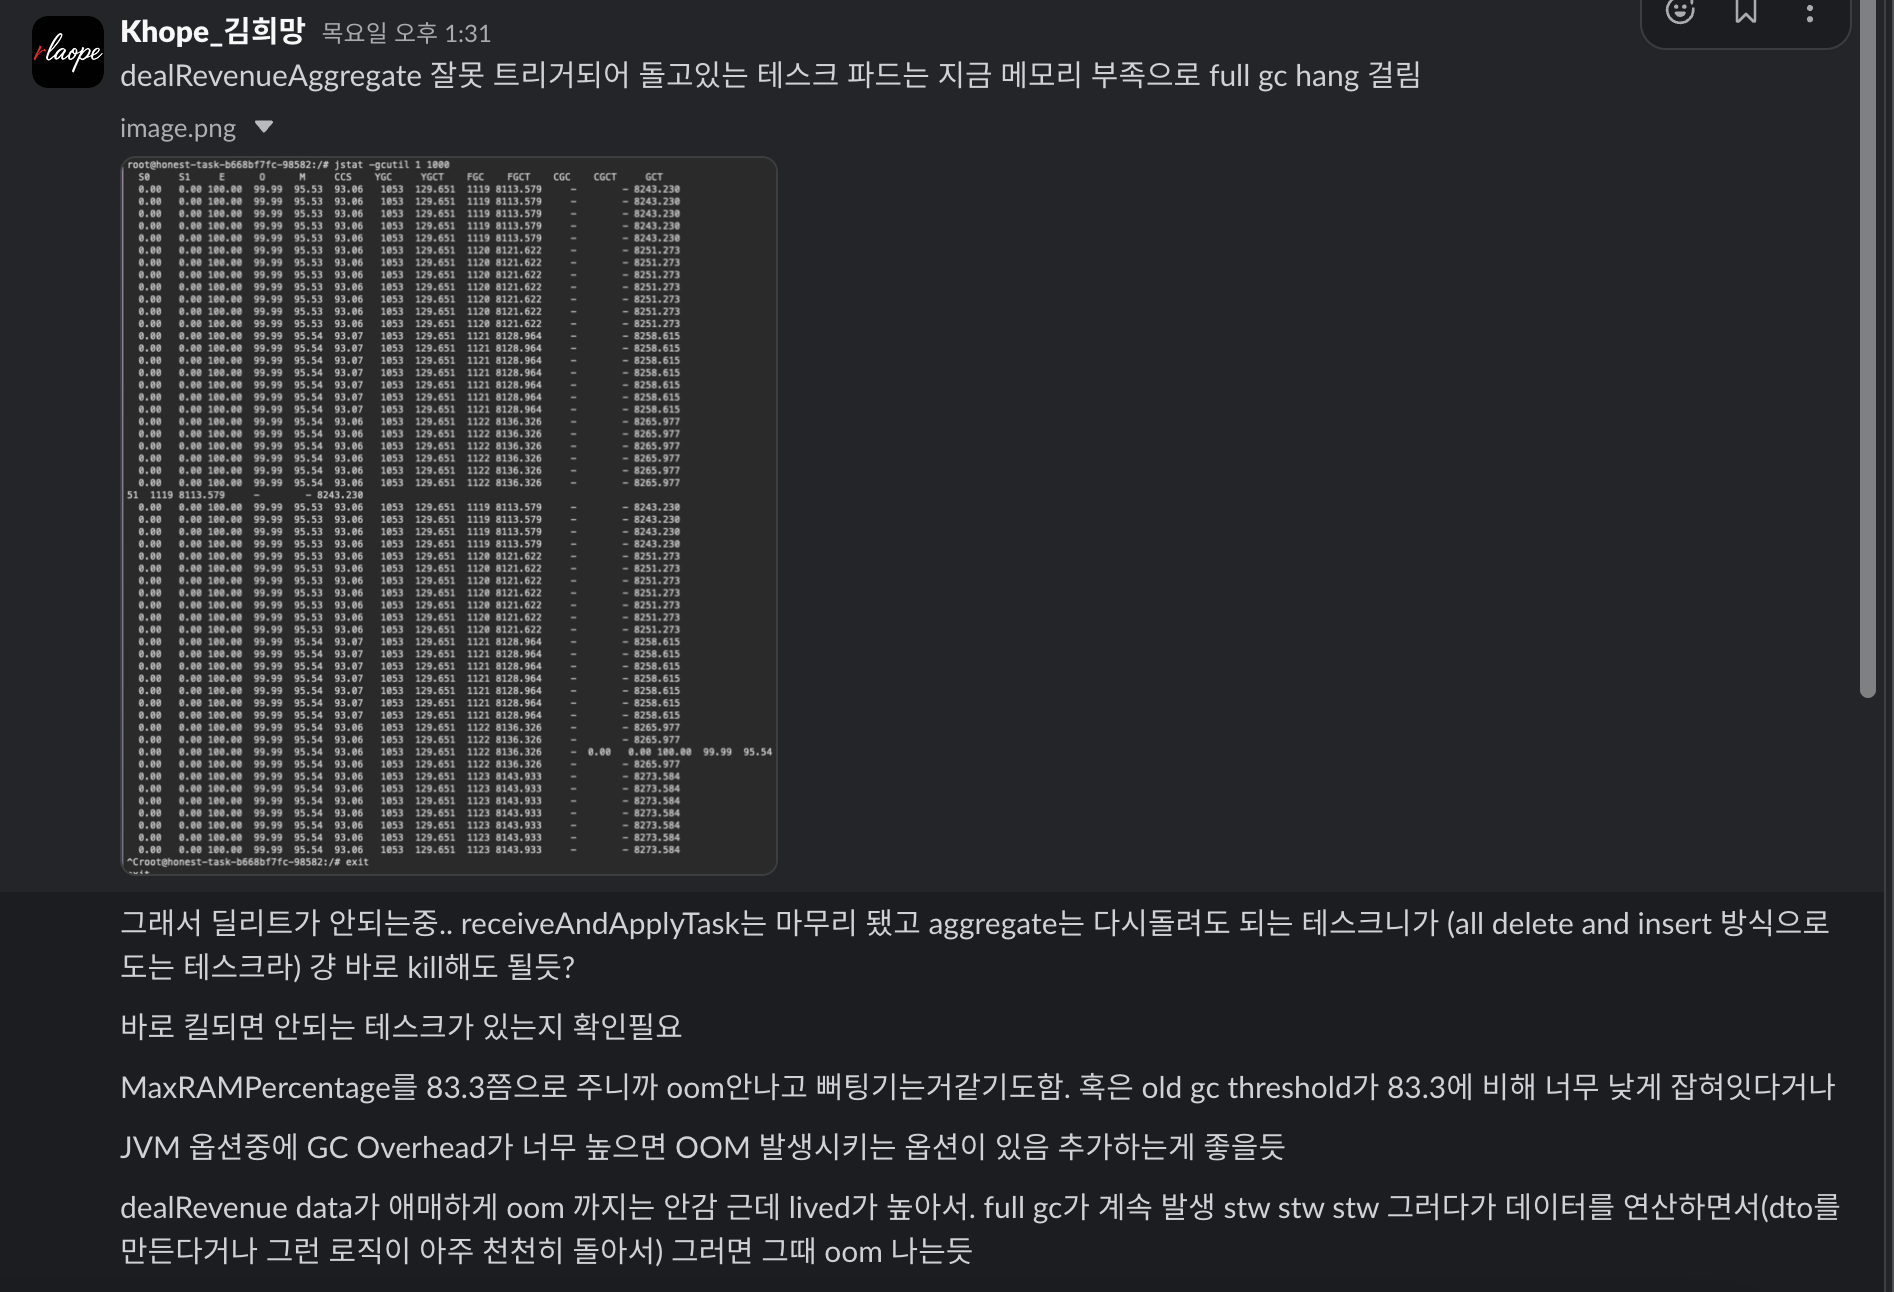
Upon inspection, it was found that Full GC time, after a certain period (from 3 hours onward), spent over 90% in STW (Stop-The-World).
So, in the data aggregation logic, only 1 or 2 items were processed, then it hit STW again, but all the data remained in memory...
While insufficient Heap Size was certainly true, I considered the fact that OOM didn't occur immediately to be a separate issue.
Upon checking, MaxRAMPercentage was set to 83.3%.
It seems that in the past, being a task server, the decision was to allocate a large heap size. Basically, when the JVM triggers an OOM,
there's an option called GCOverheadLimit that triggers OOM by detecting GC overhead. It's enabled by default (GC time ratio >= 98%), but unfortunately,
instead of hitting this limit, OOME occurred first due to the amount of heap allocated by MaxRAMPercentage.
JVM's memory areas include not only the heap but also native memory, metaspace, code cache, thread stack, and more. So, regarding the problem of insufficient heap size, I thought increasing the heap size might have been the right approach. It had 8GB, but I increased it to 16GB to complete the task that day.
Heap size tuning #
First, before simply increasing the 8GB, MaxRAMPercentage was lowered to 60%. The default is 50%, but since it's a task server, I set it to 60%. My personal theory is that this might create more room in the code cache and native memory areas, potentially allowing for higher optimization levels, but anyway.
Ultimately, I believe the problem itself was processing all data by loading it entirely into memory.
The structure of this monthly settlement task is one that inserts aggregated data, but there isn't just one target for aggregation (borrowers, investors, fees, etc.). There's a lot of data, and each task is separated, with the ability to be triggered and extracted when needed.
However, such accounting data is required every month-end. So, the code that combines these individual task codes into one is precisely this task.
Of course, not all target data is loaded into memory. All individual target data is loaded into memory. For now, it's set up to load and insert data in chunks. There is no separate update mechanism.
There are also tasks for data validation that can be checked, and since this accounting data is cross-checked by another management team, correction work is sometimes handled at that point.
Conclusion #
- Improved JVM observability with JMX Prometheus Exporter
- Detected full GC hang with AlertManager
- Prevented OOME by improving task code that caused full GC hang and tuning heap
What was gained includes observability (metrics, alerts, heap dump), OOME prevention, task server optimization, and the cost of burdensome settlement operations.