G1GC, ZGC Performance Comparison Test
zgc: http://github.com/esperar/estudy/blob/master/Back-End/JAVA/zgc.md
Scenario #
Purpose: G1GC, ZGC comparison test
- Instance: c7g.2xlarge (8 vCPU, 16BiB) instance baseline
- JDK 21 (GenZGC available)
- 300
800 RPS request/response (15ms logic + serialization) - Allocation rate divided into 2 cases
- A: Medium allocation (e.g., less than 5~10GB/s)
- B: Very high allocation (e.g., 20~30GB/s, utilizing all cores)
The reason for this division is that while ZGC reduces tail latency like p999, it has been observed in practice that G1 can be more advantageous in terms of throughput when the allocation rate becomes extremely high.
GenZGC is a GC that introduces the existing generational concept (young/old). It maintains ZGC's goal of short pauses while improving CPU efficiency by quickly collecting short-lived objects in the young generation. ZGC, focused on low latency, sometimes sacrifices CPU efficiency. When old and new objects coexist, CPU utilization increases due to read barriers during reads. Therefore, GenZGC combines the generational GC concept to optimize by quickly collecting short-lived objects.
We will extract the following metrics:
- Latency: p50/p95/p99/p999, max
- Throughput: RPS/TPS, error rate
- GC: pause histogram, concurrent time, allocation rate, gc cause
- System: CPU%, RSS, context switch, run queue
- JVM: safepoint time (important), heap usage, native memory
Simulation Example Results #
CaseA Medium Allocation Rate (Typical High-Traffic API)
Assumptions: heap 8GB, live set 35GB, RPS pushed to 7085% CPU utilization
- G1GC
- Throughput (RPS): 100% baseline
- Response Latency: avg 8ms / p99 35ms / p999 180ms
- GC Pause: p99 25ms / max 300~800ms (occasional long pauses cause tail spikes)
- CPU 70~85%
- RSS (Process Memory): Sum of heap + native relatively low
- ZGC (GenZGC)
- Throughput (RPS): -0~10% compared to G1 (can be reversed depending on environment)
- Response Latency: avg 9ms / p99 20ms / p999 60ms
- GC Pause: mostly limited to single digits ~ near 10ms
- CPU: +5 ~ 15% compared to G1 (read barrier/concurrent operation cost)
- RSS: Tendency to increase compared to G1 (metadata/concurrent relocation overhead)
- There are mentions that GenZGC, in particular, can increase native footprint.
In summary, for Case A, ZGC significantly reduced p999 and used slightly more CPU and memory in exchange for fewer interruptions.
Latency: ZGC wins; Memory/CPU usage: G1GC wins
CaseB Very High Allocation Rate (Extreme Load Utilizing All Cores)
- G1GC
- Throughput (RPS): 100% baseline
- Latency: avg 12ms / p99 60ms / p999 250ms
- GC Pause: max hundreds of ms ~ several seconds
- ZGC
- Throughput (RPS): -5~20% compared to G1
- Latency: Up to p99, it might be similar or better, but with extreme allocation, it could even be disadvantageous.
- CPU increases further
- RSS increases further
In summary, if the allocation rate becomes insanely high, G1 might be able to withstand it better.
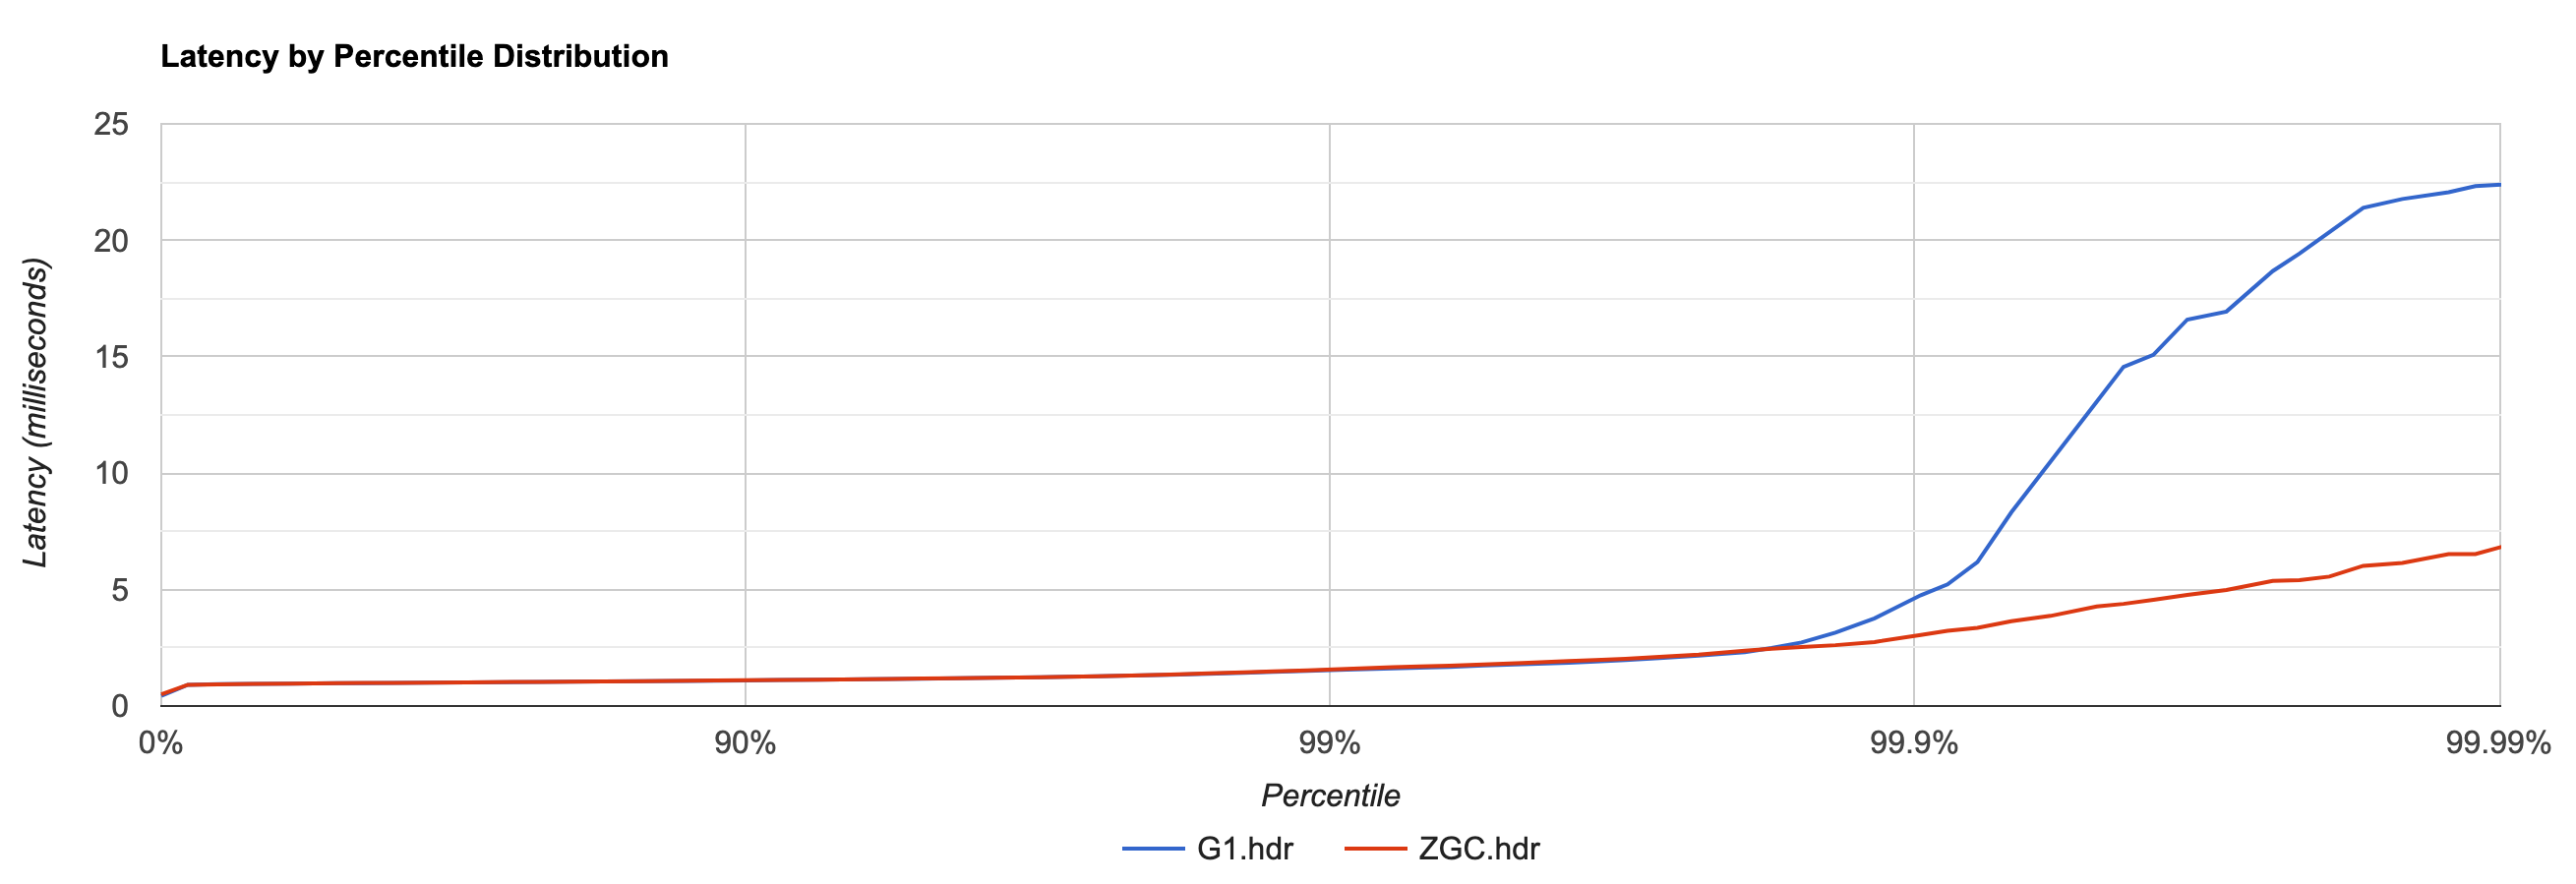
This trend is also consistent with public benchmarks.
https://www.morling.dev/images/zgc_basic_latency_g1.png
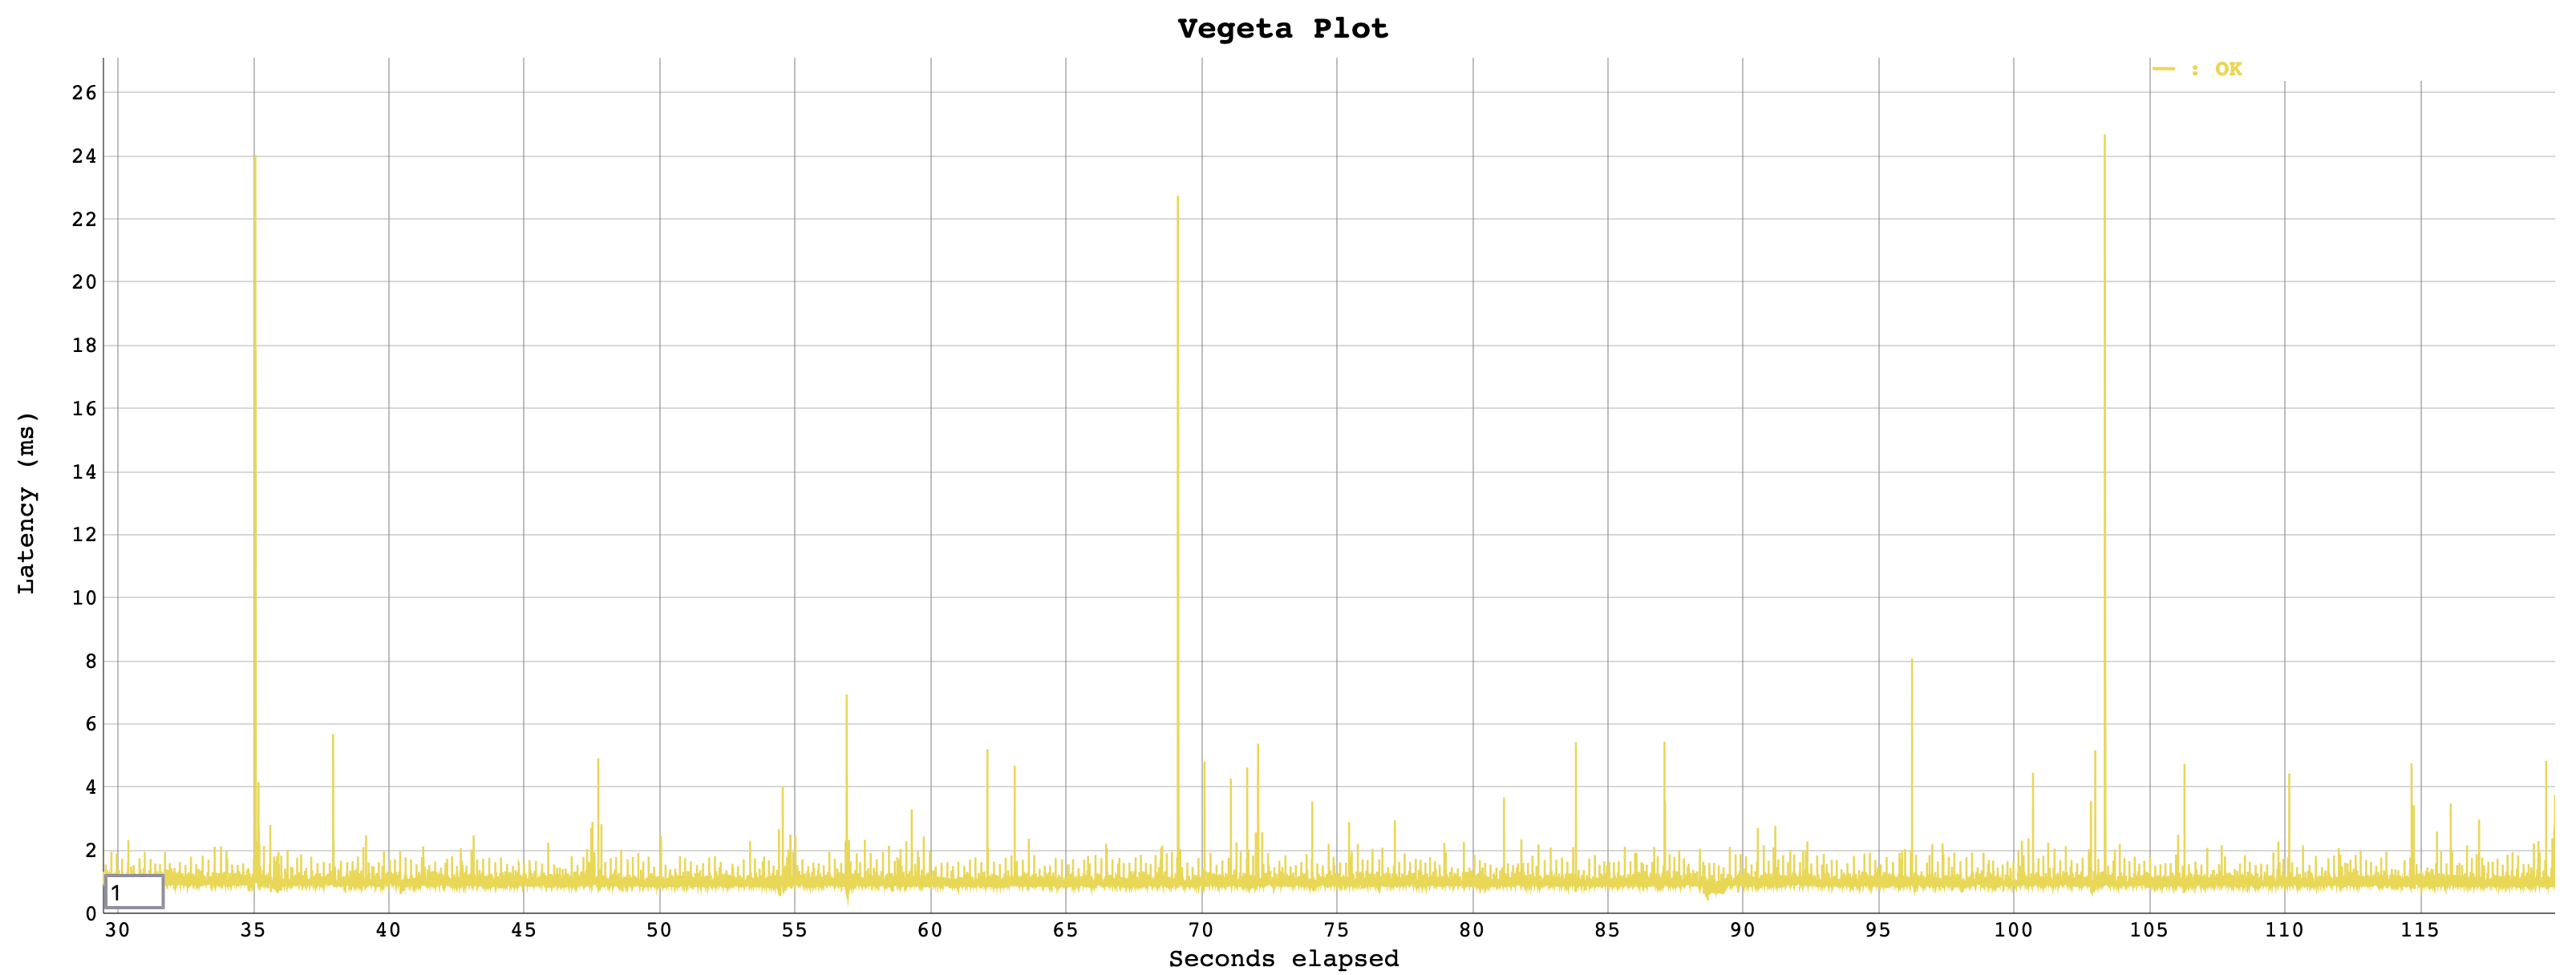
G1GC:
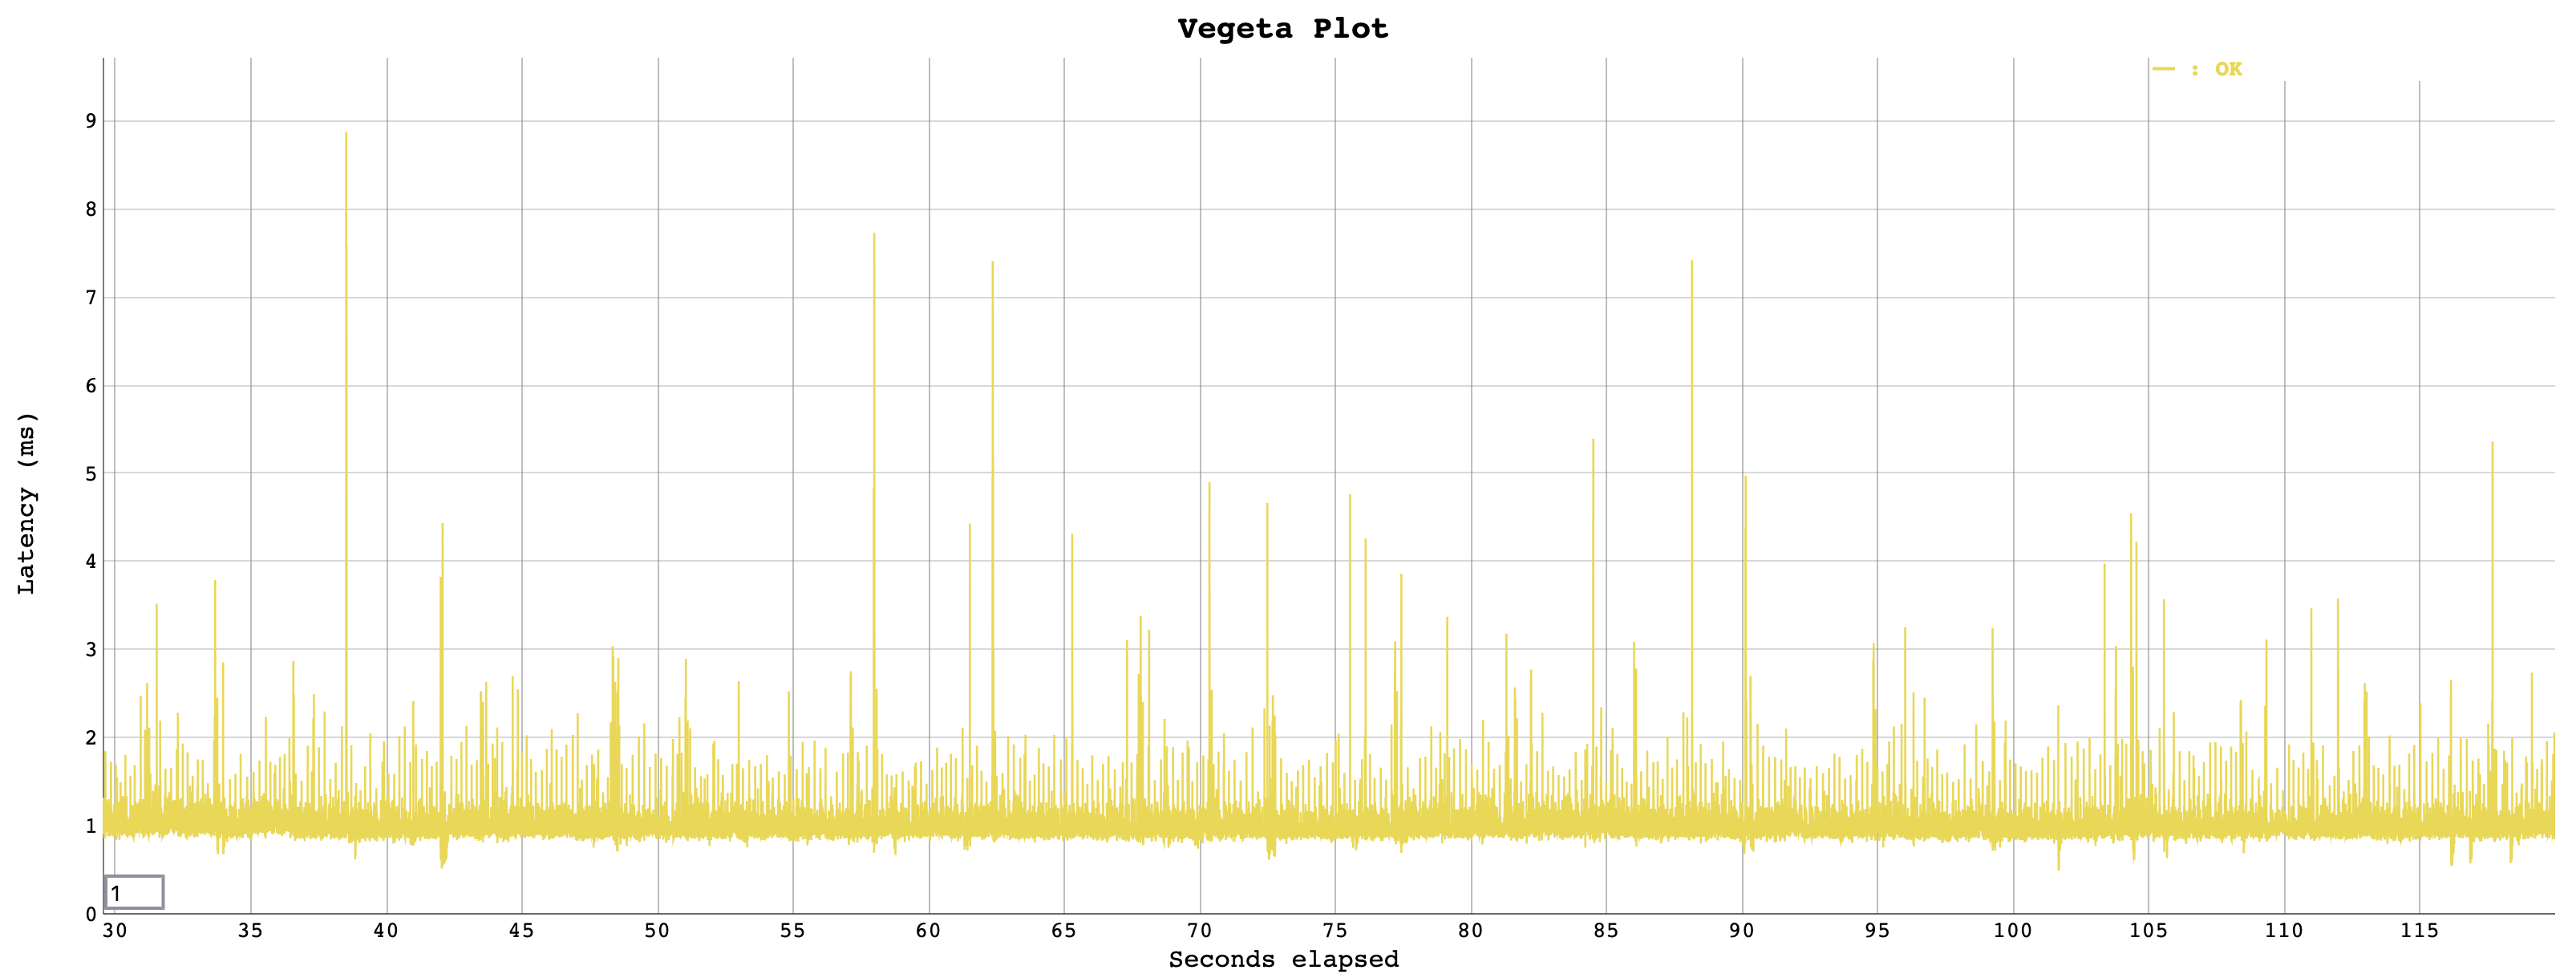
ZGC:
JDK 21 GC logs use the -Xlog:gc*,safepoint:file=gc.log:time,level,tags tool
JFR: -XX:StartFlightRecording=...
Using Prometheus JMX server and k6 as a load testing tool
JVM Options for Comparison #
G1 uses -XX:+UseG1GC, -XX:MaxGCPuaseMillis=200 (this is a target value, not guaranteed)
ZGC uses -XX:+UseZGC
Conclusion #
If service p999 interruptions are an issue, ZGC is often advantageous. However, if the CPU is always fully utilized and the allocation rate is extreme, G1 might show higher throughput.
+GenZGC is often aimed at improving tail latency, and when long pauses are observed with G1, improvements in workload are sometimes reported.