Logistic Regression Theory
I will explain logistic regression, one of the representative models in regression analysis.
Unlike the linear regression models we've covered so far, logistic regression is used as a classification technique.
GLM #
First, looking at the Generalized Linear Model (GLM), its assumptions are independence, normality, homoscedasticity, and linearity.
GLM can be used when these basic assumptions cannot be met.
Typically, this applies when the dependent variable does not follow a normal distribution, or when it is categorical rather than continuous.
When these basic assumptions are not satisfied, we can extend to a generalized linear model using the concept of a "link function".
Model selection can be done by specifying the distribution of the dependent variable and the link function.
Logistic regression is a type of GLM that assumes the dependent variable follows a binomial distribution and utilizes the logit function.
Logistic Regression #
It is used as a classification technique when the dependent variable is categorical with two classes.
However, classification is performed through probability values. For example, values above 50 percent are classified as 1, otherwise 0.
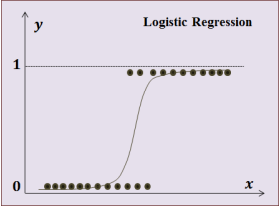
For example, when you have data like a 10% chance of passing an exam after studying for 1 hour, 24% for 2 hours, 35% for 3 hours, and 83% for 9 hours,
you can use a logistic regression model when you want to classify pass/fail status per hour as 1 or 0.
The regression equation to calculate this can be expressed as follows:
However, a problem arises here: the dependent variable's range is 0, 1, but the independent variable's range is [-∞, ∞].
When a general linear equation like this is expressed, there's no guarantee that the probability value will always be between 0 and 1.
To solve this, a link function is used; specifically, in logistic regression, the sigmoid function is applied to return probability values.
Simply put, it's easy to think of it as representing 0 if it's negative, and 1 if it exceeds 1.

It has this shape.
AUROC (Area Under ROC) #
Accuracy can be insufficient as a metric because it changes depending on the threshold.
For example, if a 49% probability of passing was judged as a fail, the actual data might have been a pass.
To compensate for this, AUROC is a metric whose value does not change with the threshold.
It is one of the metrics used to evaluate the performance of a classification model, calculated as the area under the ROC curve.
The ROC curve is a graph that visually represents the performance of a classification model by varying its threshold. The curve plots the false positive rate (FPR) on the x-axis and the true positive rate (TPR) on the y-axis.
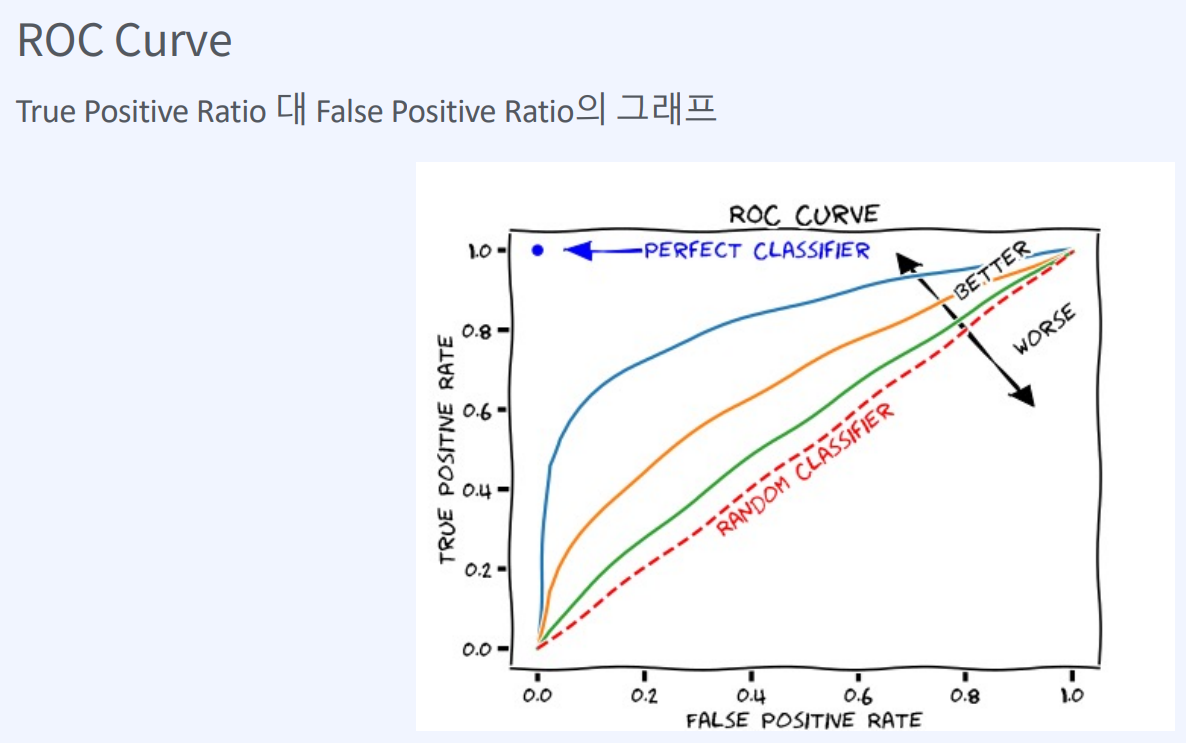
A quick look at FP, FN, TP, TN.

- true positive: Judged as true and actually true.
- false positive: Judged as true, but the actual value was false.
- true negative: Judged as false and actually false.
- false negative: Judged as false, but actually true.
The True Positive Rate (TPR) is a metric that represents the proportion of actual positive data points that the model predicted as positive in a classification model.
TPR is also known as Sensitivity or Recall.
Conversely, FPR is a metric that represents the proportion of actual negative data points that the model incorrectly predicted as positive in a classification model. FPR is equal to 1 minus the specificity.
An FPR closer to 0 is considered good, indicating that the model's negative predictions align with actual negatives, whereas an FPR closer to 1 is considered poor performance.
The definition of a threshold is the criterion used to convert probability values into categorical ones. In a logistic regression model, the probability value of the dependent variable is output as a value between 0 and 1, and this probability value is converted based on the threshold. For example, if the pass/fail decision is based on 50% or higher, then 50 is the threshold.